Health Checks
Configure Kubernetes liveness, readiness, and startup probes for your QuickStack applications.
Health checks let the Kubernetes cluster automatically monitor and restart unhealthy containers. QuickStack maps them to three native Kubernetes probes:
| Probe | Purpose |
|---|---|
| Startup | Waits up to 5 minutes for initial app startup |
| Readiness | Gates traffic: only routes requests to ready pods |
| Liveness | Restarts the container if it stops responding |
Health check types
HTTP Health Checks
Sends a GET request to a specified path. The app is healthy if the response is 2xx–3xx.
Use when: your app exposes an HTTP/HTTPS endpoint (e.g. /health, /healthz, /api/status).
TCP Health Checks
Attempts a TCP connection to a specified port. Success = healthy.
Use when: your app uses a non-HTTP protocol (databases, message queues, gRPC).
Configuring health checks
- Open your app and go to the Advanced tab.
- Scroll to Health Check Settings.
- Toggle Enable Health Check.
- Select HTTP Probe or TCP Probe.
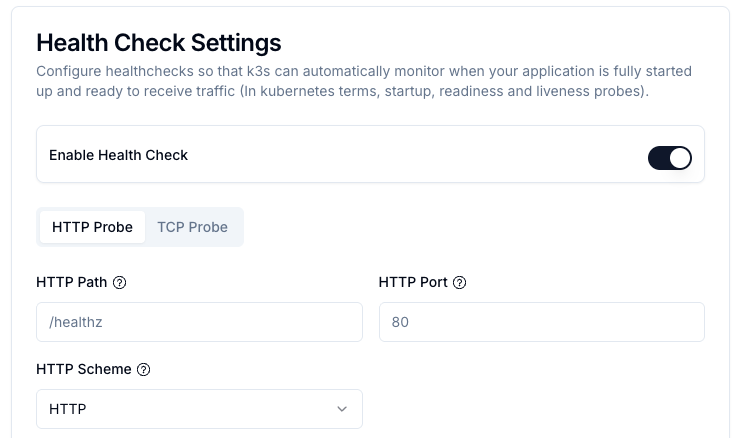
HTTP parameters
| Parameter | Description | Default |
|---|---|---|
| HTTP Path | Endpoint to check (e.g. /health) | — |
| HTTP Port | Port the app listens on | — |
| HTTP Scheme | HTTP or HTTPS (independent of domain TLS) | HTTP |
| HTTP Headers | Optional custom headers (e.g. for auth) | — |
| Interval (Period) | Seconds between checks | 15 |
| Timeout | Max seconds to wait for response | 5 |
| Failure Threshold | Consecutive failures before marking unhealthy | 3 |
TCP parameters
| Parameter | Description | Default |
|---|---|---|
| TCP Port | Port to probe (e.g. 5432 PostgreSQL, 3306 MySQL, 6379 Redis) | — |
| Interval (Period) | Seconds between checks | 15 |
| Timeout | Max seconds to wait | 5 |
| Failure Threshold | Consecutive failures before marking unhealthy | 3 |
Redeployment required Health check changes only take effect after redeployment.
Recommended setup by scenario
| Scenario | Type | Notes |
|---|---|---|
| Web app / REST API | HTTP | Use a dedicated /health endpoint |
| PostgreSQL / MySQL | TCP | Port 5432 / 3306 |
| Redis / RabbitMQ | TCP | Port 6379 / 5672 |
| gRPC service | TCP | Probe the gRPC port |
Timing guidelines
- Production interval: 15–30 seconds
- Development: 5–10 seconds for faster feedback
- Timeout: 3–5 seconds (must be less than interval)
- Failure threshold: 3–5 (balances false positives vs. recovery speed)
Example: 15s interval × 3 failures = 45 seconds to mark unhealthy.
Troubleshooting
App keeps restarting:
- Check if interval/timeout are too aggressive.
- Verify health endpoint returns 2xx/3xx.
- Increase failure threshold to tolerate transient failures.
Health checks never succeed:
- Verify the HTTP path or TCP port matches what the app actually listens on.
- Check if the app needs more startup time (increase startup probe tolerance).
- Confirm the endpoint is accessible without authentication, or add the required header.
App marked "Not Ready" on startup:
- Normal for up to 5 minutes during initialization.
- Check logs for startup errors.
Debugging:
- Open the app's Overview tab and look for probe failure events.
- Check logs for connection errors or exceptions during health checks.
- Verify port numbers and HTTP paths match your app's configuration.