Cluster Monitoring
QuickStack provides comprehensive monitoring capabilities to help you track the health and resource usage of your cluster. With visual dashboards and metrics, you can ensure your cluster is running optimally and identify potential issues.
Overview
The monitoring features in QuickStack include:
- Node Resource Visualization: View CPU, memory, and disk usage across all cluster nodes
- Status Indicators: Real-time status of all applications
- Storage Metrics: Track disk usage and storage capacity
Accessing Monitoring
- Select Cluster Monitoring: Choose Monitoring from the settings menu.
Node Resource Monitoring
Once in the Monitoring section, you will see an overview of your cluster's nodes and their resource usage.
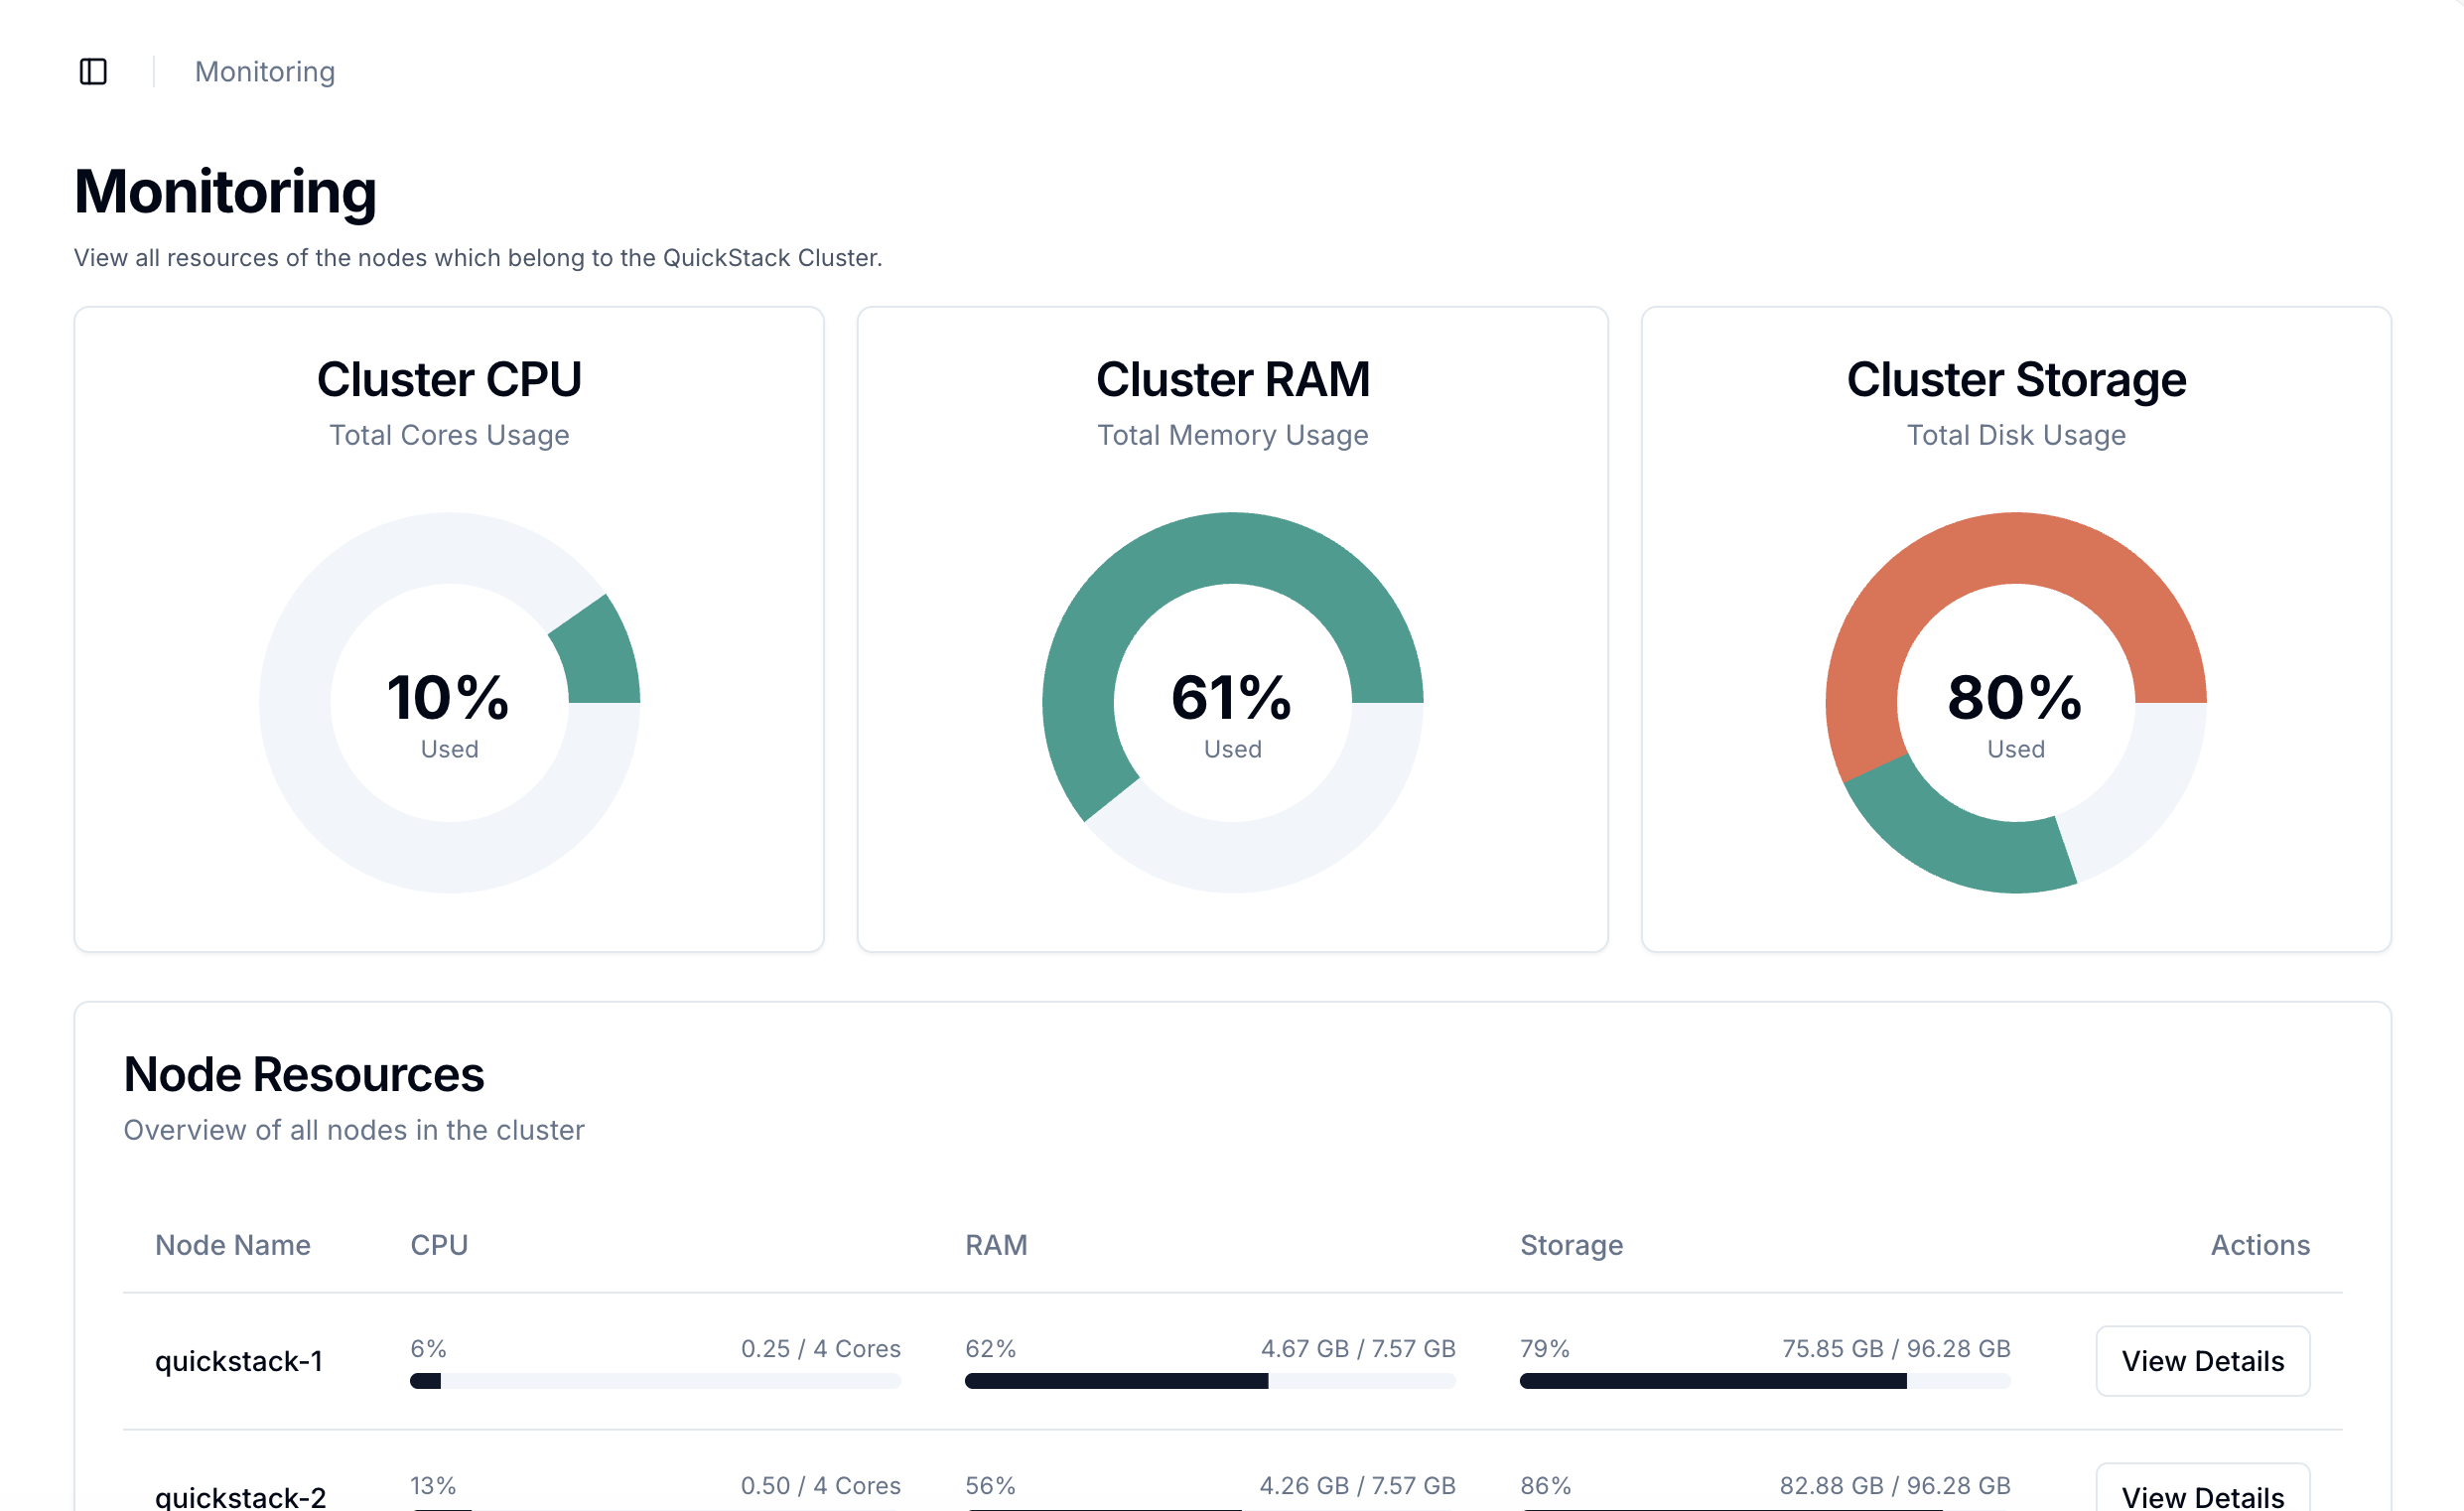
Understanding the Metrics
- Color Coding:
- 🟢 Green: < 80% used (healthy)
- 🟡 Yellow: 80-90% used (monitor)
- 🔴 Red: > 90% used (action needed) --> Add more ressources to existing servers or add a server node to your cluster
High Resource Usage
When CPU / RAM / Disk usage exceeds 80%, QuickStack displays a warning. Critical issues may occur above 90% usage, including:
- Failed deployments
- Backup failures
- Application crashes
- System instability
Disk
For the disk usage, three metrics are shown:
- Used Disk Space: Amount of disk space currently in use on the node
- Free but unusable Disk Space: Disk space that is free but cannot be used due to system reservations
- Available Disk Space: Remaining disk space available for use by deloyed applications
Used and Free but unusable disk space together represent the total "used" disk space on the node.