How toAdmin
Cluster Monitoring
Monitor CPU, RAM, and disk usage across QuickStack cluster nodes.
Accessing the monitoring view
Go to Settings → Monitoring to see CPU, memory, and disk usage across all cluster nodes.
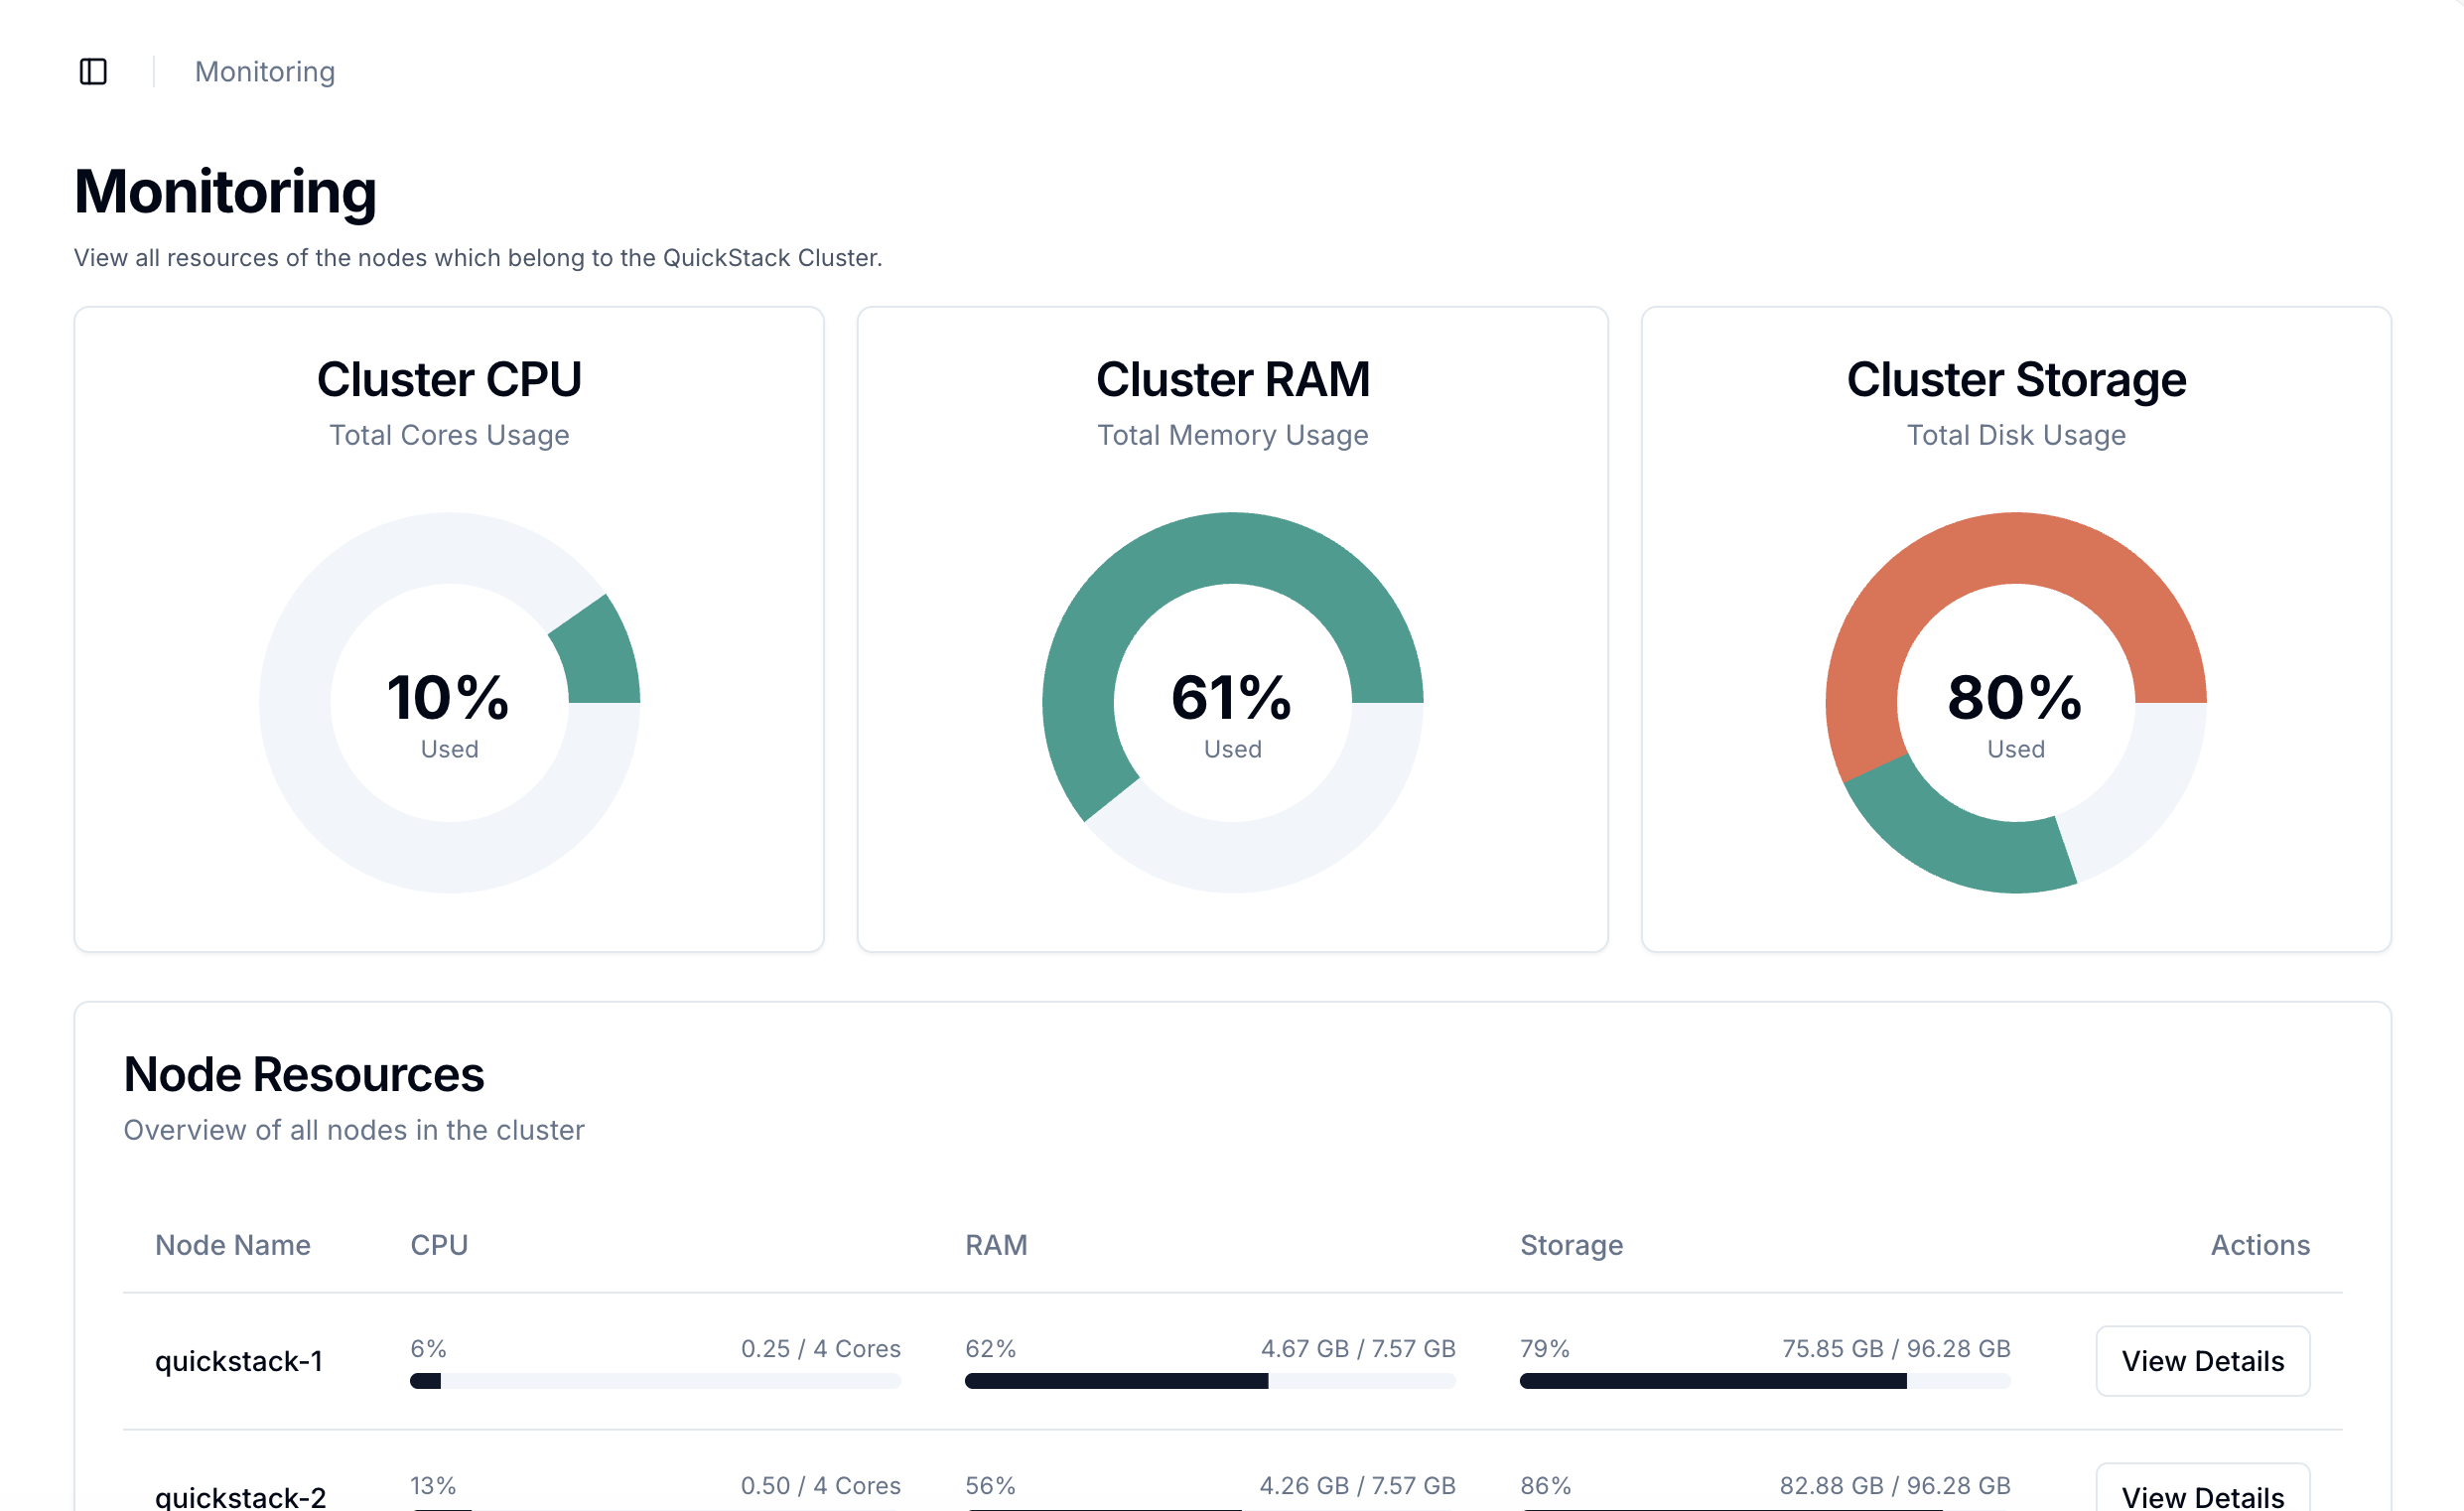
Understanding metrics
Color coding
| Color | Threshold | Action |
|---|---|---|
| 🟢 Green | < 80% used | Healthy |
| 🟡 Yellow | 80–90% used | Monitor closely |
| 🔴 Red | > 90% used | Action needed |
When usage exceeds 90%, you may see: failed deployments, backup failures, app crashes, or system instability.
Disk metrics
Three disk metrics are shown per node:
- Used Disk Space — currently in use
- Free but Unusable Disk Space — free but reserved by the OS
- Available Disk Space — usable by deployed applications
Used + Free but Unusable = total "occupied" disk space on the node.
What to do when resources are high
| Resource | Over 90% action |
|---|---|
| CPU | Optimize workloads or add more nodes |
| RAM | Review container memory limits; add RAM or nodes |
| Disk | Run disk cleanup; expand disk or add nodes |
Related
- Cluster nodes — add/remove nodes
- Updates & maintenance — disk cleanup tools