Health Checks
Health checks allow the underlying Kubernetes cluster to automatically monitor the health and availability of your applications. By configuring health checks, you ensure that your applications are automatically restarted when they become unresponsive and that traffic is only routed to healthy instances.
Overview
Under the hood, QuickStack uses Kubernetes probes to monitor your applications:
- Startup Probe: Checks if the application has started successfully (waits up to 5 minutes for initial startup)
- Readiness Probe: Determines if the application is ready to receive traffic
- Liveness Probe: Monitors if the application is still running properly and restarts it if it becomes unresponsive
QuickStack's health checks utilize Kubernetes' native probe mechanisms. This ensures reliable monitoring and automatic recovery of your applications without manual intervention.
Health Check Types
QuickStack supports two types of health checks:
HTTP Health Checks
HTTP health checks send HTTP GET requests to a specific endpoint in your application. The application is considered healthy if the endpoint returns a status code in the 200-399 range.
Use HTTP checks when:
- Your application exposes an HTTP API
- You have a dedicated health endpoint (e.g.,
/health,/healthz,/api/health) - You want to verify the application logic is working correctly
TCP Health Checks
TCP health checks attempt to establish a TCP connection to a specific port. If the connection succeeds, the application is considered healthy.
Use TCP checks when:
- Your application uses a non-HTTP protocol (e.g., databases, message queues)
- You only need to verify that the service is listening on a specific port
- Your application doesn't expose an HTTP interface
Configuring Health Checks
Accessing Health Check Settings
- Navigate to Your Application: Open your project dashboard and select the application you want to configure.
- Go to Advanced Tab: Click on the Advanced tab in the application details page.
- Locate Health Check Settings: Scroll down to the Health Check Settings card.
Setting Up HTTP Health Checks
-
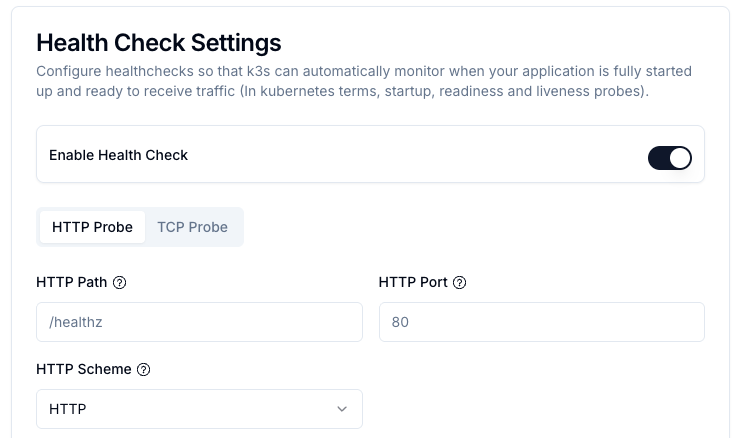
Enable Health Checks: Toggle the Enable Health Check switch to activate health monitoring.
-
Select HTTP Probe: Ensure the HTTP Probe tab is selected.
-
Configure HTTP Settings and Timing Parameters:
Parameter Description HTTP Path The endpoint path to check (e.g., /health,/healthz,/api/status). Must return a 2xx or 3xx status code when healthy.HTTP Port The port number on which your application listens. Usually the same as your application's internal port (e.g., 80,3000,8080).HTTP Scheme Choose between HTTPorHTTPS. SelectHTTPSif your application uses TLS/SSL. Note: This is independent of whether your domain uses HTTPS — you can have an HTTPS domain with an HTTP health check if your application doesn't support HTTPS internally.HTTP Headers (Optional) Add custom headers to the health check request. Useful for authentication or custom routing requirements. Click Add Header to add a new header with name and value. Interval (Period) How often the health check is performed (in seconds). Default: 15 seconds. Lower values provide faster detection but increase load. Timeout Maximum time to wait for a response (in seconds). Default: 5 seconds. Should be lower than the interval. Failure Threshold Number of consecutive failures before marking as unhealthy. Default: 3. Example: With a 15s interval and threshold of 3, the app is marked unhealthy after 45 seconds. -
Save Configuration:
- Click Save Settings to apply the changes.
After changing health check settings, you must redeploy your application for the changes to take effect. Navigate to the Overview tab and click the Deploy button.
Setting Up TCP Health Checks
-
Enable Health Checks: Toggle the Enable Health Check switch to activate health monitoring.
-
Select TCP Probe: Click on the TCP Probe tab.
-
Configure TCP Settings and Timing Parameters:
Parameter Description TCP Port The port number to check. For databases: PostgreSQL ( 5432), MySQL/MariaDB (3306), MongoDB (27017), Redis (6379). For custom applications, use the port your service listens on.Interval (Period) How often the health check is performed (in seconds). Default: 15 seconds. Lower values provide faster detection but increase load. Timeout Maximum time to wait for a response (in seconds). Default: 5 seconds. Should be lower than the interval. Failure Threshold Number of consecutive failures before marking as unhealthy. Default: 3. Example: With a 15s interval and threshold of 3, the app is marked unhealthy after 45 seconds. -
Save Configuration:
- Click Save Settings and redeploy your application.
Best Practices
Timing Configuration
- Startup Phase: Applications get up to 5 minutes to start (configurable via startup probe)
- Production Intervals: 15-30 seconds is typically sufficient
- Development: Can use shorter intervals (5-10 seconds) for faster feedback
- Timeout: Set to 3-5 seconds for most applications
- Failure Threshold: 3-5 consecutive failures balances false positives vs. recovery time
When to Use Which Type
| Scenario | Recommended Type | Reason |
|---|---|---|
| Web Applications | HTTP | Can verify application logic and API availability |
| REST APIs | HTTP | Natural fit for HTTP-based services |
| Databases (PostgreSQL, MySQL, etc.) | TCP | Most databases don't expose HTTP endpoints |
| Message Queues (Redis, RabbitMQ) | TCP | Simple connectivity check is sufficient |
| gRPC Services | TCP | gRPC runs over TCP |
| Applications with health endpoints | HTTP | Allows deeper health verification |
Troubleshooting
Common Issues
Application keeps restarting:
- Check if health check interval and timeout are too aggressive
- Verify your health endpoint returns 2xx/3xx status codes
- Increase the failure threshold to allow for transient failures
- Check pod logs for the actual health check failures
Health checks never succeed:
- Verify the HTTP path or TCP port is correct
- Ensure your application is actually listening on the specified port
- Check if your application requires more startup time (adjust startup probe)
- For HTTP checks, verify the endpoint is accessible without authentication
Intermittent failures:
- Your application might have resource constraints (CPU/memory)
- Database or external service connections might be timing out
- Consider increasing the timeout value
- Increase failure threshold to tolerate occasional failures
Application marked as "Not Ready":
- This is normal during initial startup (up to 5 minutes allowed)
- Check if your application needs more time to initialize
- Review logs to see what's preventing the application from becoming ready
Debugging Health Checks
-
Check Pod Events:
- Navigate to the application's Overview tab
- Look for events related to liveness/readiness probe failures
-
Review Logs:
- Health check failures often leave traces in application logs
- Look for connection errors or exceptions during health checks
-
Verify Configuration:
- Double-check port numbers match your application's configuration
- Ensure HTTP paths start with
/ - Verify scheme (HTTP vs HTTPS) matches your application